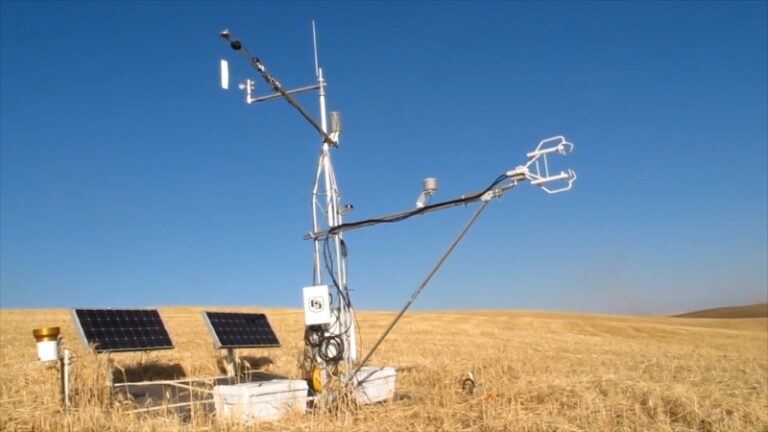
Eddy covariance (EC) towers have revolutionized how scientists understand and monitor climate trends. These towers directly measure the exchange of gases—primarily carbon dioxide (CO₂), water vapor, and energy—between the Earth’s surface and the atmosphere.
This method offers real-time, site-specific, and long-term datasets, which are crucial for identifying trends in carbon uptake and release, evapotranspiration rates, and overall energy balance.
Unlike traditional atmospheric models, EC towers provide empirical evidence of how ecosystems respond to climate stressors, such as temperature fluctuations, droughts, and human land use changes.
By comparing long-term EC data across different ecosystems (forests, grasslands, wetlands, croplands), researchers can observe trends like carbon sinks turning into carbon sources, shifts in water usage patterns, and the resilience or vulnerability of various landscapes to climate change.
This real-world data feeds directly into climate models, refining predictions about global carbon cycles and helping policymakers design better strategies to mitigate climate change.
How It Works
The eddy covariance technique is based on the principle of turbulent exchange. Here’s a breakdown:
Component
Description
Instruments
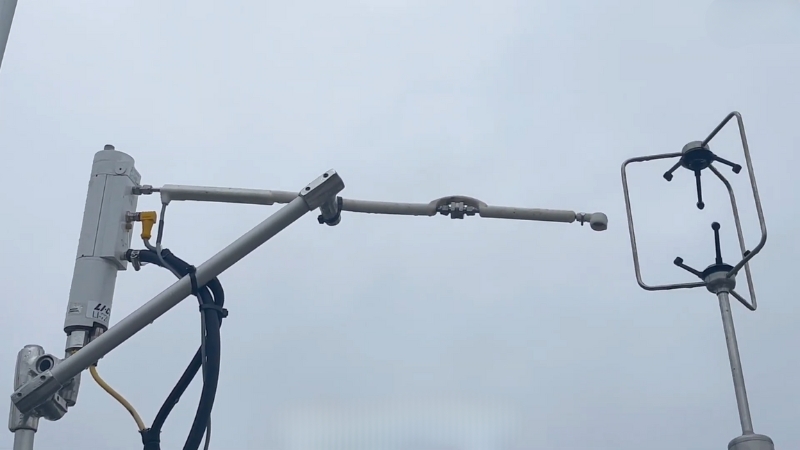
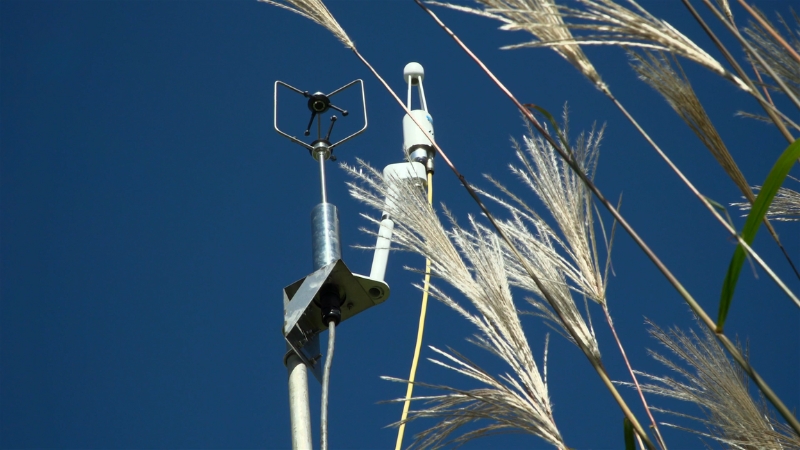
High-frequency sensors (3D anemometers, gas analyzers) mounted on towers at varying heights.
Measured Variables
Vertical wind speed, temperature, humidity, CO₂ and CH₄ concentrations, water vapor.
Flux Calculation
Measures the covariance (joint variation) of vertical wind speed and gas concentrations.
Temporal Resolution
Typically records data at 10–20 Hz (high frequency), averaged over 30-minute intervals.
Spatial Scale
Effective footprint ranges from hundreds of meters to several kilometers, depending on conditions.
In simple terms, EC towers provide a “breath-by-breath” account of the land-atmosphere exchange, giving a precise, location-based understanding of how carbon, water, and energy fluxes respond to environmental changes.
Key Insights from Eddy Covariance Towers
1. Carbon Sequestration and Release Trends
Ecosystem
Key Observations
Amazon Rainforest
Shift from carbon sink to source during severe droughts (2010, 2015–2016); up to 0.5 Pg C/year reduction.
North American Boreal Forest
Shorter snow seasons and warmer winters reduce carbon uptake; increase respiration.
European Temperate Forests
Strong spring carbon sinks; reduced summer uptake during droughts.
The Amazon, once a robust carbon sink, has demonstrated alarming shifts under extreme drought conditions.
In 2010 and again in 2015–2016, EC measurements revealed a sharp reduction in carbon uptake by as much as 0.5 petagrams of carbon annually, turning the Amazon into a net carbon source according to Copernicus.
A 24-year experiment in Caxiuanã, Brazil, found that forests under simulated drought conditions lost 40% of biomass and stored carbon.
In North American boreal forests, rising temperatures shorten the snow season, shrinking the growing season and reducing photosynthetic capacity.
Simultaneously, warmer winters increase microbial activity and respiration, eroding the carbon sink effect. European temperate forests display strong carbon sequestration in spring, but drought conditions in summer weaken their carbon balance, emphasizing seasonal variability in climate responses.
2. Water and Energy Flux Changes
Parameter
Observations
Evapotranspiration
Rising in grasslands with longer growing seasons, declines in drought-affected regions.
Latent Heat Flux
Increases during warming events; exacerbates heatwaves by enhancing atmospheric heating.
Energy Balance
Changes in albedo due to deforestation and urbanization increase local heat absorption.
Eddy covariance data reveal shifts in water and energy fluxes critical to regional climates. In grassland regions, evapotranspiration (ET) has increased due to higher temperatures and extended growing seasons, contributing to cooling effects.
However, drought-stricken areas exhibit ET decline, signaling water stress and potential crop yield reductions.
View this post on Instagram
Latent heat flux measurements indicate that during warming events, more energy is transferred into atmospheric heating rather than moisture evaporation. This dynamic can intensify local heatwaves.
Additionally, land cover changes from deforestation or urbanization alter surface albedo, reducing reflectivity and increasing solar energy absorption, thus amplifying warming effects.
3. Regional and Global Climate Implications
Climate Feedback Example
EC Tower Insights
Arctic Greening
Enhanced summer photosynthesis but higher winter respiration, offsetting carbon gains.
Tropical Peatlands
Vulnerable to drainage and warming; transitions from carbon sink to source.
Urban Heat Islands
Increased sensible heat flux and reduced evapotranspiration exacerbate urban temperatures.
In the Arctic, EC data show increased photosynthesis during longer, warmer summers (Arctic greening).
However, this benefit is partly negated by elevated winter respiration rates due to reduced snow cover and warming. This double-edged sword highlights the complexity of Arctic feedbacks as noted by NSIDC.
Tropical peatlands, which store vast amounts of carbon, are highly sensitive to land-use changes and warming.
EC measurements reveal that drainage and degradation can rapidly shift them from carbon sinks to significant carbon sources, releasing large quantities of CO₂.
Urban environments, characterized by impervious surfaces and limited vegetation, exhibit higher sensible heat fluxes and reduced evapotranspiration. This contributes to urban heat island effects, intensifying heat waves, and altering local weather patterns.
Challenges and Limitations
Despite the invaluable insights provided by eddy covariance (EC) towers, their use comes with notable challenges that must be considered when interpreting data or designing future research:
Challenge
Analysis
Limited Spatial Coverage
EC towers offer high-resolution data at specific points but lack the broad spatial coverage required for global-scale analyses. Networks like FLUXNET and AmeriFlux attempt to bridge this gap, but significant data gaps remain, particularly in tropical, boreal, and arid regions. This limits the representativeness of EC-derived insights for global climate models.
Complex Data Processing
EC data consist of high-frequency (10–20 Hz) measurements, which are susceptible to noise from instrument errors, environmental interferences (e.g., precipitation), and diurnal variability. Processing requires sophisticated filtering algorithms, gap-filling techniques, and post-processing to correct for flux losses, adding layers of complexity and potential biases.
Instrumentation Sensitivity
EC instruments—especially 3D sonic anemometers and gas analyzers—are highly sensitive to environmental conditions like strong winds, heavy rain, ice accumulation, or temperature extremes. These conditions can degrade data quality or necessitate frequent maintenance, which is logistically challenging in remote areas.
Site Accessibility and Representation
Remote, diverse ecosystems like deep forests, wetlands, and high-altitude regions are underrepresented due to logistical challenges of tower installation and maintenance. This skews data availability toward more accessible regions (e.g., temperate forests, croplands), potentially underestimating the carbon and energy dynamics of globally significant but less-studied ecosystems.
These challenges underscore the need for careful interpretation of EC data, particularly when extrapolating site-specific findings to regional or global scales.
Moreover, they highlight the necessity of complementary approaches, such as satellite remote sensing and modeling, to fill spatial and temporal gaps.
Future Directions and Innovations
The EC field is rapidly evolving, leveraging technological and methodological advancements to overcome limitations and enhance its contributions to climate science.
Innovation
Analysis
Expansion of Tower Networks
Networks such as FLUXNET, AmeriFlux, and AsiaFlux are scaling up to improve global coverage, focusing on underrepresented ecosystems like tropical peatlands, permafrost zones, and arid lands. This expansion will enhance our understanding of diverse ecosystem responses and improve the calibration of climate models.
Integration with Satellite Data
The fusion of EC measurements with satellite remote sensing (e.g., MODIS, Sentinel) enables the extrapolation of site-specific flux data across larger regions. This integration supports high-resolution mapping of carbon, water, and energy exchanges and helps validate global Earth system models.
Machine Learning Applications
Advanced machine learning algorithms are increasingly applied to EC datasets, automating quality control, anomaly detection, and gap-filling. These tools can handle complex, high-volume data and reveal patterns not readily apparent through traditional analysis, improving the robustness of flux estimates and trend identification.
Climate Resilience Monitoring
New EC tower installations are being strategically deployed in climate-vulnerable areas, such as permafrost regions, tropical peatlands, and coastal wetlands. These installations provide early warning signals of ecosystem tipping points, such as permafrost thaw releasing methane or peatland drainage accelerating CO₂ emissions. They also inform regional adaptation strategies and conservation priorities.
In summary, while EC towers have inherent constraints, ongoing innovations and integrations with other data sources are transforming them into a cornerstone of climate monitoring.
Their role is set to expand, offering ever-more detailed, scalable insights into the complex interplay between land, atmosphere, and climate systems.
Conclusion
@burrenfarmexperience how to assemble an eddy covariance flux tower #farm #sustainability #climatechange #farmingfornature #biodiversity #viral_video #fyp #blowup ♬ Power Up – Super Sound
Eddy covariance towers offer a real-world lens into how our planet breathes, reflecting the intricate dance between ecosystems and the atmosphere.
By directly measuring carbon, water, and energy exchanges, EC towers reveal critical trends in carbon sequestration, water cycling, and climate feedbacks.
Their data is not just academic, it’s vital for refining climate models, understanding regional climate risks, and guiding global climate policies.
As climate change accelerates, expanding and integrating EC networks will be crucial for capturing the pulse of Earth’s changing climate.