Real-time carbon flux tracking provides a continuous stream of data on carbon exchange, revealing ecosystem dynamics, pinpointing human impacts, and evaluating mitigation strategies.
Unlike sporadic sampling, continuous measurement captures rapid fluctuations in CO₂ fluxes driven by natural events and human activities. This approach informs accurate climate modeling, supports policy decisions, and enhances ecosystem management.
Concrete examples highlight its importance: during the 2018 European drought, continuous CO₂ flux tracking revealed a sudden shift from carbon sink to source in affected forests, impacting carbon budget assessments.
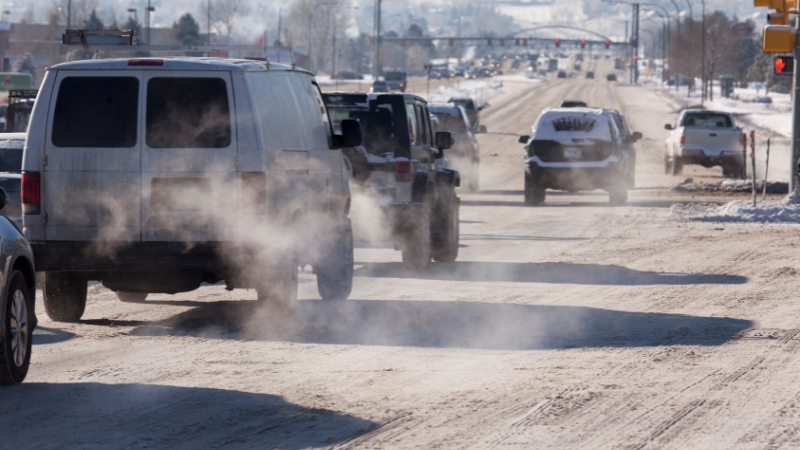
Similarly, urban monitoring systems in megacities like Beijing or Los Angeles show how daily traffic and industrial activity shape local carbon footprints.
Scientific Foundations of Carbon Flux Tracking
Carbon flux represents the net exchange of CO₂ between ecosystems and the atmosphere. Major flux components include:
Flux Type
Description
Gross Primary Production (GPP)
CO₂ is absorbed by photosynthesis.
Ecosystem Respiration (Reco)
CO₂ is released by plant and microbial respiration.
Net Ecosystem Exchange (NEE)
GPP minus Reco, indicating net CO₂ flux.
Real-time flux tracking involves continuous measurement of these components, using micrometeorological methods such as eddy covariance (EC).
This technique measures vertical turbulent fluxes of CO₂, water vapor, and energy at high frequencies (10–20 Hz), providing granular insights into ecosystem carbon dynamics.
Technological Advances Enabling Real-Time Tracking
Eddy Covariance Systems
EC towers, equipped with 3D sonic anemometers and infrared gas analyzers, form the backbone of carbon flux monitoring.
Recent advances in real-time data transmission and automated quality control have improved their responsiveness.
FluxPro System
To overcome data processing challenges, the FluxPro system integrates data gathering, processing, and visualization:
Component
Function
Data Gathering
Collects raw EC data from distributed sites.
Data Processing
Computes CO₂ fluxes, removes errors, and calculates uncertainties.
Data Presentation
Visualizes flux data in near-real time for analysis and decision-making.
FluxPro improves operational efficiency and decision-making, especially in large-scale monitoring networks.
Satellite and Model Integration
Real-time flux tracking increasingly integrates EC data with remote sensing (MODIS, Sentinel) and atmospheric inversion models.
CarbonTracker Europe High-Resolution (CTE-HR), for example, combines satellite observations with land-use, weather, and economic activity data to estimate CO₂ exchange at high spatial resolution across Europe.
Case Studies in Real-Time Carbon Flux Tracking
1. The 2018 European Drought: A Carbon Sink Turns into a Source
The summer of 2018 brought an unprecedented drought to Europe, characterized by prolonged heat waves and minimal precipitation.
This climatic anomaly provided a unique opportunity to study the immediate impacts of extreme weather events on carbon fluxes across various ecosystems.
Key Observations
- Ecosystem Response: Data from 52 eddy covariance stations across Europe revealed that many ecosystems, particularly forests, shifted from being carbon sinks to carbon sources during the drought period. This was primarily due to reduced photosynthetic activity and increased respiration rates under stress conditions.
- Spatial Variability: The impact varied geographically. Northern European regions, with peatland ecosystems, showed significant reductions in methane uptake and alterations in carbon dioxide fluxes according to the Royal Society Publishing.
- Legacy Effects: The drought’s impact extended beyond 2018. Studies indicated that the affected ecosystems exhibited altered carbon flux patterns in subsequent years, highlighting the prolonged effects of such extreme events.
Implications
These observations underscore the importance of continuous carbon flux monitoring. Real-time data allowed researchers to detect rapid changes in ecosystem behavior, providing insights into the resilience and adaptability of various biomes under extreme climatic stress.
2. COVID-19 Lockdowns: A Natural Experiment in Urban Carbon Emissions
View this post on Instagram
The global lockdowns in response to the COVID-19 pandemic led to abrupt reductions in industrial activities and transportation. This unprecedented situation served as a large-scale experiment to assess human impact on urban carbon emissions, according to arXiv.
Key Observations
- Urban Emission Reductions: Eddy covariance measurements across 13 stations in 11 European cities recorded significant declines in CO₂ emissions during lockdown periods, with reductions ranging from 5% to 87%, depending on the city’s infrastructure and lockdown stringency.
- Case Study – Indianapolis: In the U.S., researchers utilized eddy covariance techniques to measure CO₂ fluxes in Indianapolis. The study found notable decreases in fossil fuel emissions, particularly in areas dominated by vehicular traffic, confirming the direct link between human activity and urban carbon emissions.
- Rapid Rebound: Post-lockdown periods saw a swift return of CO₂ emissions to pre-lockdown levels in many cities, emphasizing the transient nature of the reductions and the persistent influence of human activities on urban carbon budgets, as noted by CMCC.
These findings highlight the critical role of real-time carbon flux monitoring in urban planning and policy-making. The ability to promptly detect changes in emissions can inform strategies for sustainable urban development and climate change mitigation.
3. Urban Carbon Monitoring
Cities like Beijing and Tokyo employ high-resolution carbon flux tracking using EC towers, ground-based sensors, and atmospheric models.
These systems enable near-real-time tracking of urban emissions and inform policies for cleaner transportation and industrial regulation.
Applications of Continuous Carbon Flux Data
Application Area
Example Use Case
Urban Planning
Optimizing traffic and industrial emissions reductions.
Agriculture
Precision irrigation and fertilization to enhance carbon sequestration.
Forestry Management
Monitoring carbon sink capacity of reforested areas.
Climate Policy
Evaluating the effectiveness of emission reduction policies and carbon trading schemes.
Urban Planning: Optimizing Traffic and Industrial Emissions Reductions
Real-time carbon flux data in urban environments provide a critical tool for policymakers and city planners aiming to reduce greenhouse gas emissions.
By installing eddy covariance (EC) towers and integrating them with atmospheric modeling and remote sensing data, cities can monitor CO₂ emissions from vehicular traffic, industrial facilities, and residential areas.
Continuous data reveal temporal patterns such as rush-hour spikes, weekend reductions, and seasonal variations.
This enables precise targeting of emission sources and informs traffic control measures, such as low-emission zones, congestion pricing, or timing of traffic lights to reduce idling. Industrial zones benefit from continuous monitoring by adjusting production schedules or implementing new technologies to curb emissions.
A notable example is Tokyo’s real-time monitoring system, which integrates ground-based sensors and satellite data to map CO₂ hotspots. This has allowed the city to implement targeted emission reduction strategies while maintaining economic activity.
Agriculture: Precision Irrigation and Fertilization to Enhance Carbon Sequestration
In agriculture, real-time carbon flux tracking informs sustainable land management practices. Continuous CO₂ flux data help farmers optimize irrigation and fertilization, improving photosynthesis efficiency and promoting carbon sequestration in soils.
For example, in arid regions, real-time monitoring of evapotranspiration alongside carbon uptake allows for precise watering schedules, reducing water waste while maximizing crop productivity.
Similarly, adjusting fertilizer application based on real-time GPP measurements can reduce nitrogen runoff, lower greenhouse gas emissions, and enhance soil carbon storage.
Forestry Management: Monitoring Carbon Sink Capacity of Reforested Areas
Forests play a crucial role in the fight against climate change by absorbing CO2 from the atmosphere. Read about forests in EU countries and EU plans to strengthen their role as carbon sinks ↓
— European Parliament (@Europarl_EN) May 20, 2022
Forests play a crucial role as carbon sinks, and real-time carbon flux tracking enables forest managers to assess and enhance their sequestration capacity.
Eddy covariance towers deployed in reforested areas provide continuous data on CO₂ absorption and release, allowing managers to detect disturbances like pest outbreaks, drought stress, or human encroachment.
By analyzing real-time data, managers can implement adaptive strategies, such as selective thinning, pest control, or targeted irrigation, to maintain or boost carbon uptake.
Climate Policy: Evaluating Emission Reduction Policies and Carbon Trading Schemes
Accurate, continuous data are vital for evaluating the effectiveness of national and international climate policies, including carbon trading mechanisms.
Real-time flux tracking offers transparent, high-resolution evidence of CO₂ emissions reductions, enabling verification of compliance with agreements like the Paris Accord.
Additionally, continuous monitoring can detect unintended consequences of policies, such as shifts in land use patterns or emissions leakage to neighboring regions.
For instance, the European Union Emissions Trading System (EU ETS) has integrated carbon flux data to monitor compliance and adjust allowances, helping ensure environmental integrity while maintaining economic competitiveness.
Challenges in Real-Time Carbon Flux Tracking
Challenge
Details
Data Integration
Harmonizing EC, satellite, and model data with standardized protocols.
Spatial Coverage
Expanding monitoring networks into underrepresented regions like Africa or the Arctic.
Technical Limitations
High costs, site accessibility issues, and instrument maintenance.
Data Latency
Some models (e.g., CTE-HR) have up to two-month delays for high-resolution outputs.
Data Integration: Harmonizing EC, Satellite, and Model Data

Integrating data from diverse sources—including EC towers, satellite sensors, and atmospheric models—presents a significant challenge. Each data stream comes with unique spatial, temporal, and calibration characteristics, requiring standardized protocols for merging and interpreting them accurately.
Additionally, discrepancies in measurement scales (e.g., point-based EC data vs. broader satellite footprints) can introduce errors.
Advanced data assimilation techniques, such as variational assimilation and machine learning-based fusion models, are being developed to reconcile these differences and produce cohesive, actionable insights.
Spatial Coverage: Expanding Monitoring Networks
Many regions critical to global carbon dynamics, including parts of Africa, the Arctic, and remote island ecosystems, lack sufficient carbon flux monitoring infrastructure. This gap hampers s comprehensive understanding of carbon exchange patterns and limits the accuracy of global carbon budget models.
Establishing EC towers or deploying low-cost sensor networks in these underrepresented areas is essential.
Collaborative international efforts, such as the Integrated Carbon Observation System (ICOS) and the Global Carbon Project, are working to expand coverage but face logistical and funding challenges.
Technical Limitations: Costs, Accessibility, and Maintenance
Real-time flux tracking systems, especially eddy covariance towers, involve substantial costs for equipment procurement, installation, calibration, and ongoing maintenance. Instruments are sensitive to environmental conditions, requiring regular cleaning and calibration to ensure data integrity.
Remote or harsh environments pose additional challenges in terms of power supply, communication infrastructure, and technician access. Moreover, processing the high-frequency data (10–20 Hz) requires robust computing capabilities and skilled personnel, limiting widespread adoption.
Data Latency: Delays in Model Outputs
While eddy covariance systems can provide near-instantaneous data, regional or global carbon flux models (e.g., CTE-HR) often suffer from data latency of several weeks to months. This delay arises from the need to assimilate diverse data streams, perform quality control, and run complex simulations.
Although models offer high-resolution insights, this latency reduces their utility for real-time decision-making, especially during rapidly evolving events like wildfires or droughts. Reducing latency through enhanced computational methods and streamlined data pipelines is a key area of ongoing research.
Future Directions and Innovations
- Low-Cost Sensor Deployment: Development of affordable, autonomous CO₂ sensors (e.g., open-path analyzers) can democratize flux tracking.
- AI and Machine Learning: Advanced algorithms for real-time data filtering, gap-filling, and anomaly detection improve accuracy and usability.
- Integrated Networks: Combining EC, satellite, drone, and ground-based observations can expand spatial and temporal resolution.
- Resilience Monitoring: Focus on vulnerable ecosystems (e.g., permafrost, peatlands) to anticipate climate tipping points.
Conclusion
Real-time carbon flux tracking offers unparalleled insights into the Earth’s carbon cycle. Its continuous nature captures the temporal variability of CO₂ exchange, enhancing climate models, informing policies, and enabling adaptive ecosystem management.
As technologies evolve and networks expand, the global community can leverage these advancements to mitigate climate change and build a sustainable future.