To accurately measure greenhouse gases (GHGs) in the field, scientists primarily rely on four categories of tools: nondispersive infrared (NDIR) spectroscopy, cavity ring-down spectroscopy (CRDS), flux-based instruments like eddy covariance towers and flux chambers, and remote sensing platforms including satellites and drones.
Each method leverages the unique way GHG molecules absorb specific wavelengths of infrared light—creating identifiable “spectral fingerprints”—to detect and quantify these gases in the atmosphere, often in parts per million or billion. This is how we know that CO₂ concentrations reached 426.89 ppm in May 2024, and methane levels hover around 1.92 ppm, according to NOAA and Scripps.
Overview
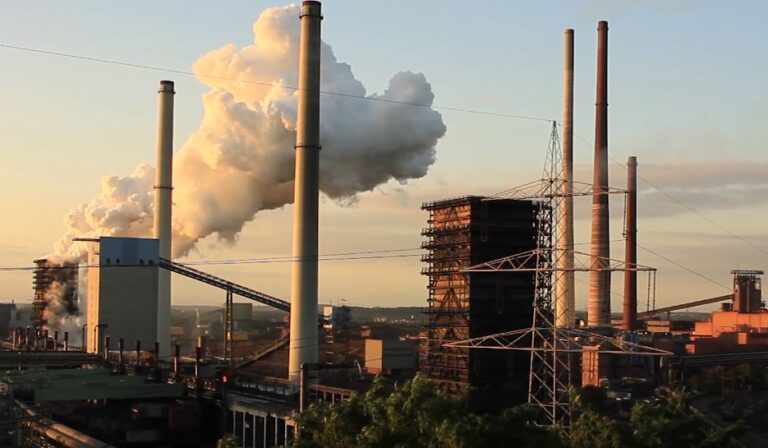
Greenhouse gases are invisible, odorless, and present in minute concentrations—but their impacts on the climate are immense. Since the 1994 UN Framework Convention on Climate Change, the global goal has been to stabilize GHG concentrations and avoid dangerous climate disruption.
Despite international agreements like the Kyoto Protocol and Paris Agreement, concentrations of CO₂, CH₄, and N₂O continue to rise, except for chlorofluorocarbons (CFCs), which are declining due to the 1987 Montreal Protocol.
Here are 2023 global averages:
| Gas | Symbol | Global Warming Potential (100 yrs) | Avg. Atmospheric Concentration |
| Carbon dioxide | CO₂ | 1 | 419 ppm |
| Methane | CH₄ | 27–30 | 1.92 ppm |
| Nitrous oxide | N₂O | 273 | 0.337 ppm |
| Fluorinated gases | Various | 1,000s–10,000s | < 1 ppt |
To track progress, identify sources, and enforce policies, scientists need accurate, real-time, and large-scale GHG measurement tools.
1. Nondispersive Infrared (NDIR) Spectroscopy
View this post on Instagram
NDIR spectroscopy is one of the oldest and most widely used techniques for measuring GHGs, particularly CO₂. It works by passing infrared light through an air sample and measuring how much of the light is absorbed at specific wavelengths. A filter ensures that only wavelengths absorbed by the target gas—such as 4.26 microns for CO₂—reach the detector. The more gas present, the more light is absorbed, which allows the instrument to quantify the concentration.
NDIR was the method used by Charles David Keeling in 1958 to begin monitoring atmospheric CO₂ levels at Mauna Loa Observatory. His data series, known as the Keeling Curve, showed for the first time that CO₂ levels were steadily rising, as noted by ACS.
In 1958, CO₂ concentration was 313 parts per million (ppm). As of May 2024, the concentration had increased to 426.89 ppm—a 36% rise. NDIR remains a standard tool in many monitoring stations around the world due to its robustness and reliability, although newer methods offer higher sensitivity.
Historical Impact: The Keeling Curve
- In 1958, Charles David Keeling used NDIR to begin tracking CO₂ at Mauna Loa Observatory.
- His data, known as the Keeling Curve, showed CO₂ increasing from 313 ppm in 1958 to 426.89 ppm in May 2024.
- Seasonal patterns revealed Earth’s natural carbon cycle, with CO₂ lows in summer and highs in winter due to plant activity.
Used In:
- Ground stations
- Environmental research stations
- Long-term atmospheric monitoring
2. Cavity Ring-Down Spectroscopy (CRDS)
CRDS is a more modern technique that allows for extremely sensitive detection of GHGs, even at very low concentrations. It involves a laser tuned to a gas-specific wavelength and a highly reflective chamber.
When the laser is turned off, the light continues to bounce between the mirrors thousands of times, gradually diminishing in intensity. The rate of this “ring-down” is affected by the presence of GHGs in the chamber, which absorb some of the light. Faster decay means higher concentrations.
CRDS instruments require only small amounts of calibration gas, making them ideal for long-term field use. They are now widely deployed by organizations like NOAA and Scripps Institution of Oceanography.
According to Science Daily, CRDS sensors have been used to monitor urban emissions in Los Angeles and Washington D.C., where they detected measurable reductions in CO₂ during the COVID-19 pandemic. CRDS can also distinguish between carbon isotopes, helping identify how much CO₂ in the air comes from fossil fuels versus natural sources.
Why It’s Better
- Ultra-high sensitivity
- Lower sample volume required
- Can detect isotopic variations (e.g., fossil vs biogenic CO₂ using C-14)
Used In:
- NOAA, NASA, and Scripps long-term monitoring
- Urban GHG networks (Los Angeles, DC-Baltimore, Indianapolis)
- Detecting pandemic-related emissions drops and gas leak fixes
3. Eddy Covariance Towers and Flux Chambers
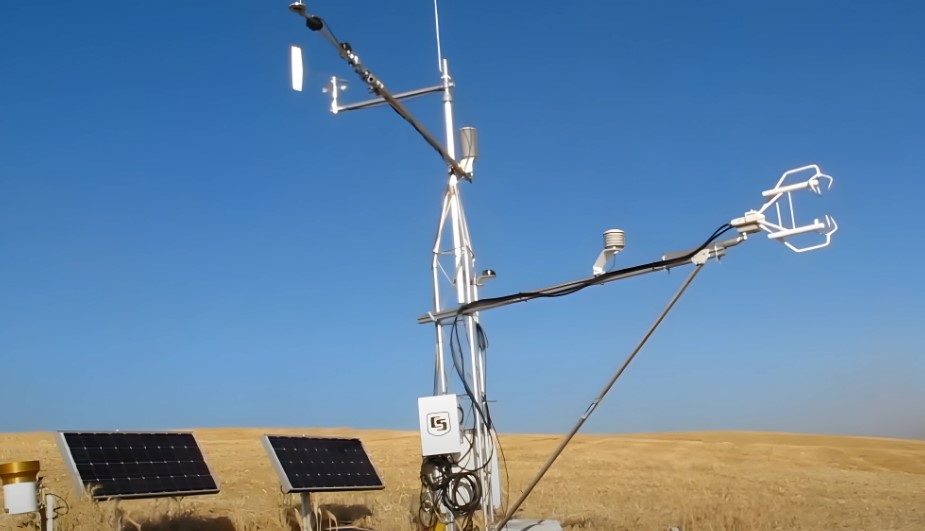
Eddy covariance is a micrometeorological method used to measure the exchange of gases between the land surface and the atmosphere. Towers equipped with 3D sonic anemometers and fast-response gas analyzers measure vertical wind speed and GHG concentrations at high frequencies (e.g., 10–20 times per second) as noted by Copernicus.
This allows scientists to calculate the net flux of gases like CO₂ and CH₄ over time.
These towers are widely deployed in ecosystems such as forests, wetlands, and grasslands to understand how these environments act as carbon sources or sinks. Data from eddy covariance networks are crucial for validating climate models and informing land-use policy.
Unlike point measurements, this method provides continuous, real-time data over large areas, though it requires significant infrastructure and data processing.
Eddy Covariance Towers
- Combine 3D sonic anemometers and fast gas analyzers to continuously measure gas fluxes between ecosystems and atmosphere.
- Used to monitor carbon exchange in forests, wetlands, and grasslands.
Flux Chambers
Flux chambers are portable devices placed over soil, vegetation, or water surfaces to measure GHG emissions from specific sources. They enclose a known volume of air and track how gas concentrations change over time.
By measuring the rate at which gases like CH₄ and N₂O accumulate inside the chamber, researchers can estimate the emission rate from the underlying surface.
Flux chambers are commonly used in agriculture to study emissions from fertilized fields, manure storage, and rice paddies.
They are also used in wetlands, landfills, and other environments where emissions are localized. While easy to deploy and relatively inexpensive, they measure only small areas and can disrupt natural conditions if not used carefully.
- Small enclosures placed over soil or vegetation.
- Used for localized flux studies, such as farm emissions or wetland methane release.
| Instrument | Gases Measured | Best For |
| Eddy Covariance | CO₂, CH₄, H₂O | Ecosystem-scale fluxes |
| Flux Chambers | CH₄, N₂O, CO₂ | Point-source or soil emissions |
4. Remote Sensing: Satellites, Aircraft, UAVs
Satellites provide global coverage of GHG concentrations by measuring sunlight that has been reflected off Earth’s surface and passed through the atmosphere.
Instruments aboard satellites like NASA’s Orbiting Carbon Observatory-2 (OCO-2) and ESA’s Sentinel-5P (with TROPOMI) use spectroscopy to analyze which wavelengths are absorbed by gases in the atmospheric column, according to eoportal. This allows for the detection of CO₂, CH₄, and other gases over broad areas.
Satellites are especially useful for identifying large emission sources, known as “super-emitters,” such as oil and gas fields or large landfills. They also provide long-term trend data that helps verify national emissions inventories.
However, they cannot directly measure emissions at the ground level and rely on complex models and reference data for calibration. Despite these limitations, satellite data have shown that landfills and fossil fuel infrastructure in the U.S. may be emitting significantly more methane than previously estimated.
Satellites
Examples: NASA’s OCO-2, TROPOMI, GHGSat
- Measure reflected sunlight in specific IR bands from space.
- Provide column-averaged GHG concentrations.
- Cannot be calibrated continuously, but use reference spectra and compare to O₂ absorption.
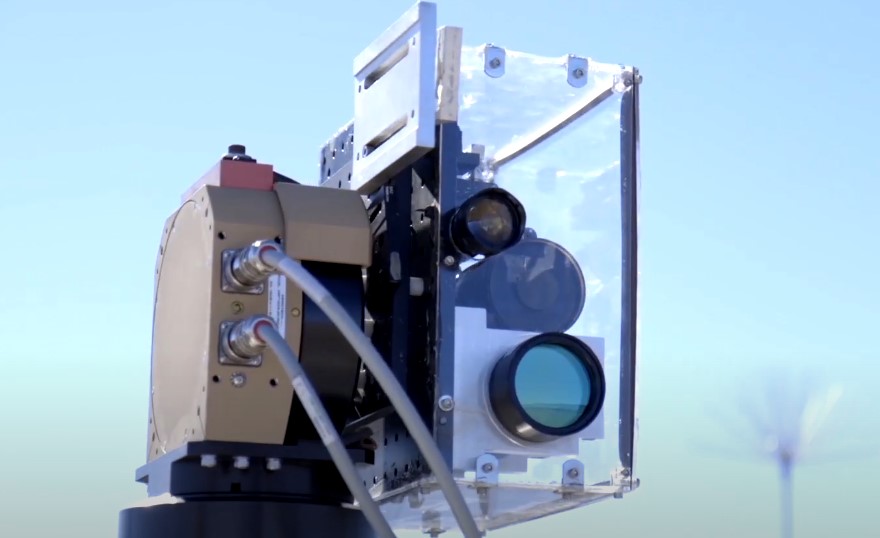
Aircraft and UAVs
Airplanes and drones equipped with CRDS or NDIR instruments provide flexible platforms for GHG measurement. They can fly over difficult terrain, target specific plumes, and collect high-resolution data.
Aircraft are often used in campaigns to measure methane leaks from oil and gas operations, while UAVs are ideal for lower-altitude, localized studies such as emissions from wetlands or livestock.
Airborne measurements played a key role in uncovering large-scale methane leaks in the Permian Basin—one of the most productive oil fields in the U.S., demonstrating their value in regulatory enforcement and environmental monitoring.
- Carry lightweight CRDS or NDIR instruments.
- Used for methane leak detection, landfill surveys, and methane plumes from oil fields.
- Example: Planes detected massive methane leaks over Permian Basin oil fields.
| Platform | Gases | Strengths |
| Satellites | CO₂, CH₄ | Global, broad-scale, detects “super-emitters” |
| Aircraft | CH₄, CO₂ | Regional surveys, accurate plume detection |
| Drones | CH₄, CO₂ | Localized, flexible access to difficult terrain |
5. Dual-Comb Spectroscopy (Experimental)
Dual-comb spectroscopy is a cutting-edge technique that uses two synchronized frequency comb lasers to measure thousands of light wavelengths simultaneously. This allows for the detection of multiple gases over a broad area with high precision.
Unlike traditional laser methods, which focus on a single wavelength, dual-comb systems provide a full spectral scan and can operate over several square kilometers.
Researchers at the National Institute of Standards and Technology (NIST) have demonstrated this technology in urban settings, where it successfully measured CO₂, CH₄, N₂O, and even pollutants like ozone and carbon monoxide.
While still experimental, dual-comb systems have the potential to combine the high resolution of CRDS with the spatial coverage of satellite measurements.
How It Works
- Uses frequency comb lasers emitting thousands of distinct wavelengths.
- Measures absorption across wide spectrum simultaneously.
- Allows mapping GHGs over several-square-kilometer areas.
Used In:
- Pilot studies for urban GHG monitoring
- Potential tool for detecting emissions from landfills, feedlots, and wastewater plants
6. Gas Chromatography (GC)
Gas chromatography (GC) is a laboratory-based technique that separates gas mixtures into individual components for precise quantification. It is often used to analyze samples collected in the field via canisters or gas-tight bags. GC can detect a wide range of gases, including fluorinated gases present at parts-per-trillion levels.
NOAA and other agencies maintain global flask networks where air samples from remote locations are sent to central labs for GC analysis.
Whole-air sampling is essential for retrospective studies and isotopic analysis. It allows scientists to archive atmospheric conditions and detect subtle changes over time. Though not real-time, it complements faster, field-based methods by providing greater accuracy and additional data layers.
- Often used in laboratories or mobile vans
- Can separate and quantify CH₄, N₂O, CO₂, and fluorinated gases
- High precision, especially for isotopic or trace gases
7. Whole Air Sampling
- Air collected in flasks or bags, analyzed later in the lab
- Allows archival storage and isotopic analysis
- Used by NOAA’s global flask network across 50+ stations
Conclusion
Accurate measurement of greenhouse gases isn’t just a scientific curiosity—it’s a cornerstone of climate accountability.
From Keeling’s first 313 ppm CO₂ reading to today’s 426.89 ppm, tools like NDIR and CRDS have laid the foundation for our understanding of climate change.
Satellites and frequency combs are the next frontier, promising to reveal hidden sources and empower smart climate policies.
Whether it’s tracking methane leaks in gas fields or CO₂ changes during lockdowns, these tools help us see the invisible—and change the future.